We have been granted permission to republish this post which was originally published by Tim Thomas
Members of Generation Z might struggle to remember a time when the US housing market prices were doing anything other than rising exponentially, but sure enough, there have been times in history when this has been the case.
The financial crisis of 2007 was one of them. Some people are wondering if the US housing market is going through something similar now — but is it a fair comparison?
The US Housing Market Throughout History
House prices in the US rose 17.1% between December 2020 and December 2021. It’s a terrifying figure for anyone currently saving for a house, and it’s also a rate that far surpassed inflation — the consumer price index increased by 7% over the same period.
With increases in average wages way behind, it’s no wonder that many people have concerns about the growing affordability crisis.
Could we find ourselves in the middle of a housing crisis once the market catches up?
To answer this question, let’s take a quick look at how the property market has performed historically. It’s true that US housing market prices tend to trend upward over time; we all need a roof over our heads, so there will always be a steady supply of people looking to purchase properties.
However, the growth rates of average prices during 2020 and 2021 were way above the average growth rate of 5.3% (taken from data between 1992 to December 2021).
While drops in house prices are fairly unusual (especially sustained drops or “crashes”), they do happen.
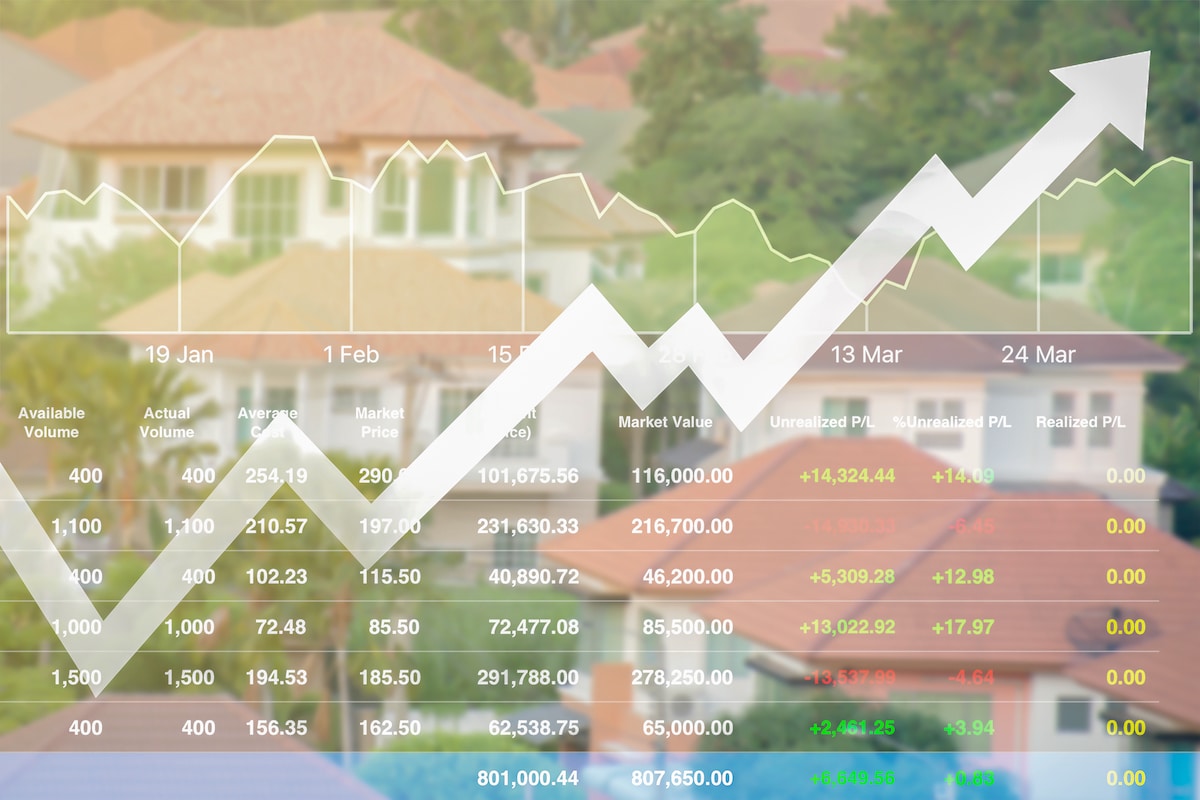
Looking at the chart below, which portrays the average sales price of US houses over time, you can see there was one major fall in house values when the financial crisis hit.
Prices began to decline around 2006 — dropping by more than 10% by 2009 — and didn’t recover until 2012.
Could we be about to experience something similar now?

JP Morgan: Could 2022 be the Next 2008?
You don’t need to look far to see suggestions that 2022 could be the beginning of the next big financial crisis. The stock market isn’t holding up well, with the S&P seemingly falling further every day.
Even precious metals, which typically do well when the stock market performs poorly, are struggling — gold has fallen from a value of $2,039 per ounce in March to $1,834 in May, representing a drop of 10% in just two months. Basically, there’s been trouble all around.
A recent report from J.P. Morgan has explored whether there’s any truth to this speculation. The nominal housing prices (which analyzes price changes relative to a base time period, in this case 2010) is now 40% higher than in 2012 and 4% greater than 2006, which was previously the peak.
Considering 2006 was the beginning of what we now know to be a major US housing market bubble, it’s not surprising many wonder if we’re about to consider another crash.
However, a market correction may not be coming. Many believe the current environment is very different from what we observed in 2006 — there’s more to the market than just price growth.
We need to look at the current state of a few other risk factors; J.P Morgan focused on debt levels and supply.
Debt Growth
Although prices are increasing quickly, debt growth isn’t taking place at quite the same rate as we saw between 2003 and 2006.
During the recovery period after the 2007 crisis, most households have been paying off their debt, meaning they were in relatively good financial situations when the pandemic came around.
Around 75% of buyers now have superprime credit scores, making them less vulnerable to changing market conditions and increased interest rates. This is a far cry from the subprime lending crisis of 2007.
Supply
One of the factors behind the 2007 crash was a sudden increase in the supply of housing, which brought supply and demand out of check and sent the market into freefall. Are we experiencing the same thing now?
It’s true that construction has increased to meet demand in many areas, such as Texas, North Carolina, Florida, and Georgia.
Yet US housing market inventory now is far lower than back in 2006. Specifically, inventory as a share of the market was five times higher during the peak of the previous crash.
Plus, in the counties where supply hasn’t risen quite as quickly, like the Midwest, prices aren’t increasing as fast as elsewhere — suggesting market forces are more in line with each other.
Part of the reason for the crash in 2007 was a sudden increase in housing supply, which we’re certainly not experiencing this time around.
Regional Variations
Not all regions are showing the same economic signals. New York and the San Francisco Bay Area are home to some of the highest prices on the market — for instance, the median home value per square foot is 20 times higher in Manhattan than in Cleveland.
The areas with the highest prices may stand the best chance of experiencing a “market correction” since they’re beginning to enter an affordability crisis.
This is even more likely in place with greater supply, like Arlington, Seattle, and Denver.
However, most counties still remain below the nominal prices index from 2006, meaning they’re unlikely to be due any kind of correction.
What Will it Be?
Overall, J.P Morgan’s conclusion is that the market looks very different now to in 2006. Whereas places with high debt had the highest prices in the past, high prices are now more correlated with constrained supply.
This means that market conditions are far more sustainable.
Rather than being on the verge of a housing crash, we might actually be in a situation more similar to 1980, when the Fed raised interest rates and made the US housing market stall.
However, with so much variation between different regions, it’s hard to make predictions and conclusions about the housing market as a whole.
Conclusion: Don’t Wait a US Housing Market Correction
It seems there’s some chance of a market correction in places with staggeringly high prices alongside a high housing supply.
However, given the slower debt growth and US housing market supply in most of the country compared to 2007, we can’t take price growth as a standalone indicator and assume we’re due another crash.
But only time will tell, so watch this space.
More Articles From Wealthy Living Partners
- Planning for Paradise: 25 Things to do in Hawaii
- Essential Things You Should Know About Biden’s First Time Home Buyer Grant Program
- Warning Signs a Big Housing Market Crash is Just Around the Corner
- Dividend Kings Stocks That You Should Add to Your Watchlist Right Now
Disclosure: The author is not a licensed or registered investment adviser or broker/dealer. They are not providing you with individual investment advice. Please consult with a licensed investment professional before you invest your money.
Learn how to diversify and hedge your long-only stock portfolio. We’ve partnered with Tim Thomas to give you the opportunity to sign up for a free insight into the Swing Trading 101 program. The program has been developed over thousands of hours of trading over hundreds of thousands of dollars across stock, commodities, options, and cryptocurrencies. It’s designed to empower you to take a unique but strategic approach to the markets. Learn more about swing trading.
Tim Thomas has investments in real estate.
This post was produced by Tim Thomas / Timothy Thomas Limited and syndicated by Wealthy Living.
Featured image credit: Shutterstock.