What is the Average True Range?
While the Average True Range (ATR) was originally developed in the 1970s to measure volatility and risk in the commodities market, all trading systems of all asset classes should be focused on risk management.
So traders in the forex market, stock, options, commodities or crypto markets should integrate the indicator in their trading strategy.
This is also true whether the trader is day-trading intraday, swing trading or trend trading for longer-term investments.
Unlike other volatility indicators such as Bollinger Bands, the ATR does not give the direction (uptrend or downtrend) or strength of trends.
Instead, the indicator only measures how far price typically deviates from the average during a particular time period.
When doing technical analysis, it is possible to assess volatility simply by looking at candlesticks.
A volatile market will typically show a mix of bullish and bearish candles. The price action during such periods is represented by relatively long wicks (shadows) and short bodies.

By contrast, the candlestick in a strongly trending market will be long-bodied, with little if any wick or shadow.

Long-bodied candles appear in trending up or down markets. In bullish markets where buyers are in control, each new candle will make a higher high and higher low than the prior candle. The opposite for bearish markets.
That said, the ATR is still a very useful indicator. It can significantly improve trading decisions and risk management.
The ATR Average True Range Formula
The average true range is an oscillator whose calculation involves intricate mathematical formulae.
Fortunately, our trading platforms will handle these for us with a couple of clicks.
But it is important to understand the ideas behind the calculations and what the indicator is telling us.
The first step is to find what is called the “True Range”, which is simply the largest of three differences in price. On a daily chart, these would be:
- Today’s high minus today’s low
- Today’s high minus yesterday’s close
- Today’s low minus yesterday’s close
But a true range figure can be derived in a similar way for any time frame. This will give the amount that the instrument has moved during that time period.
The ATR is then calculated as an Exponential Moving Average of the true ranges for a number of time periods. For forex traders and stock traders, this is typically 14.
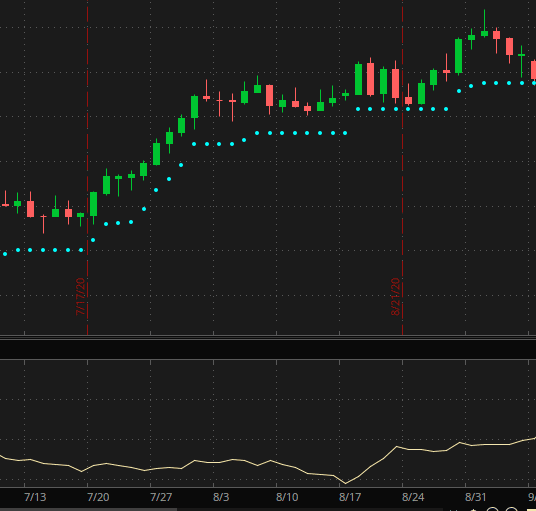
The image below shows how the ATR indicator displays as a single curving line below the candlesticks on a trading platform.
The figure at the top left of the indicator also tells us the average amount that the instrument moves during the time period of the chart.
For forex pairs, this would be measured in pips, for a commodity, points and dollars and cents for a stock).

When charting, it’s easy to see how the ATR line tracks the price action as revealed by the candlesticks.
Lagging, not predictive
That said, it’s important to understand that it’s a lagging rather than a predictive indicator. It’s perfectly possible for periods of low volatility to coincide with strong trends – and vice versa.
The ATR does not provide entry or exit trading signals such as a breakout or reversal.
However, as part of a trading strategy, it can be used in conjunction with other technical indicators to ensure optimal risk management.
When the ATR line is high or sloping steeply, for example, we may be able to set more ambitious profit targets and use wider stops.
A low and flatter line, on the other hand, may suggest a ranging market and allow us to plan our trades accordingly.
How to Use the Average True Range Indicator
Here are some proven ways to make direct use of the ATR indicator.
Setting Stop-Losses
Getting stopped out of a trade that then goes on to exceed its original profit target is one of the frustrations of trading.
This often happens because the stop loss has been set too tightly for the volatility of the instrument in question.
For example, when forex trading, a day trader who uses a 50 pip stop on a forex cross that has a normal daily range of 150 pips, is highly vulnerable to being stopped.
Whether his signal is a buy or sell, no matter how good his entry is, market volatility will stop him out.
Backtesting and developing a trading plan which includes the ATR value can reduce the risk to the forex trader.
If we are stock-trading and have a buy signal to establish a long-position, our trading rules might include monitoring our stockcharts for a break of the EMA.
A breach of that support may not be used as a sell signal only that a retracement is underway.
So far, the trade is profitable. This means that by trailing our stop we can protect a large portion of the profits we have.
A stop-loss placed 1 x ATR below the EMA will both protect our account and allow us to stay in the trade if the uptrend resumes.
Some traders may prefer to use a 2 or even 3 x ATR, but this is only advised if it allows for a risk/reward ratio of at least 1:2 (for every $1 risked, expected profit is $2).
Using the Chandelier Exit
An alternative strategy is the so-called “Chandelier” exit.
This is a trailing stop that places the stop a multiple of ATR below the highest high (if in a long position) or above the lowest low (if in a short position) since we entered the trade.
If that seems complicated, some trading platforms now offer a separate indicator that will automatically calculate a trailing stop based on the ATR (see below) and allow the trader to select the desired ATR multiple.
Setting Profit Targets
Knowing the ATR can also help set realistic profit targets and to avoid entering trades that have little chance of success.
For instance, when trading forex, we may notice that the EURUSD has been trending strongly during the day.
If its current ATR is 100 pips and the day’s range is 90 pips, it is unlikely (though not impossible) thit will offer a good opportunity.
Similarly, let’s assume a position has good profitability but the price is approaching the current ATR level.
This might be a good time to look for possible signs of a reversal or consolidation in the candlestick patterns. This might be in the form of doji or pin bar candlesticks.
While we will never exit a trade based solely on an approach to the ATR. It’s essential to wait for a clear buy or sell signal.
Conversely, if a buy or sell is signalled early in a session, the ATR may help set a profit target.
In any event, it is wise to set a target somewhat within the ATR, to maximize the chances of it being hit.
Also, it is also essential to be aware of any areas of support and resistance. These may or may not coincide with the target suggested by the ATR indicator.
Remember, this is just a measure of average volatility, and can be superseded by more immediate developments in price action.
There’s no point in setting ATR profit goals if it takes you into or beyond support and resistance levels.
The Limitations of the Average True Range
In summary, the ATR can be useful when trade planning and managing risk but it has its limitations.
Most importantly, the ATR is not a directional tool, nor does it provide entry or exit signals.
Moreover, a single ATR reading does not in itself provide any information about the strength of a trend.
Monitoring volatility and price changes can assist with our decision making – and this is the essential purpose of the indicator.
More Articles From Wealthy Living
- Best High Dividend Stocks: The Ultimate Millenials Investment Guide
- Dividend Kings Stocks That You Should Add to Your Watchlist Right Now
- Everything You Should Know About Rick Ross’ Net Worth and Other Facts
- Discover Blippi’s Net Worth and Other Fun Facts
Disclosure: The author is not a licensed or registered investment adviser or broker/dealer. They are not providing you with individual investment advice. Please consult with a licensed investment professional before you invest your money.
Neither Tim Thomas nor Timothy Thomas Limited hold positions in the stocks, ETFs, mutual funds, forex, or commodities mentioned.
This article was produced and syndicated by Wealthy Living.
Featured Image Credit: Shutterstock