As you get into the US housing market, you need a big picture view and some principal indicators that acknowledge that not all housing markets are the same.
US indicators can analyze current housing market trends when buying or selling a home, and these data sets can be valuable to homebuyers, sellers, and investors alike.
Used in the right way, they can provide signs of an imminent housing market crash.
Home prices are trending upwards or downwards, or if the market is on an upward or downward trajectory.
This article will explain the best housing market indicators, the aim is to help investors understand the causes of falling housing market prices and the associated money pain.
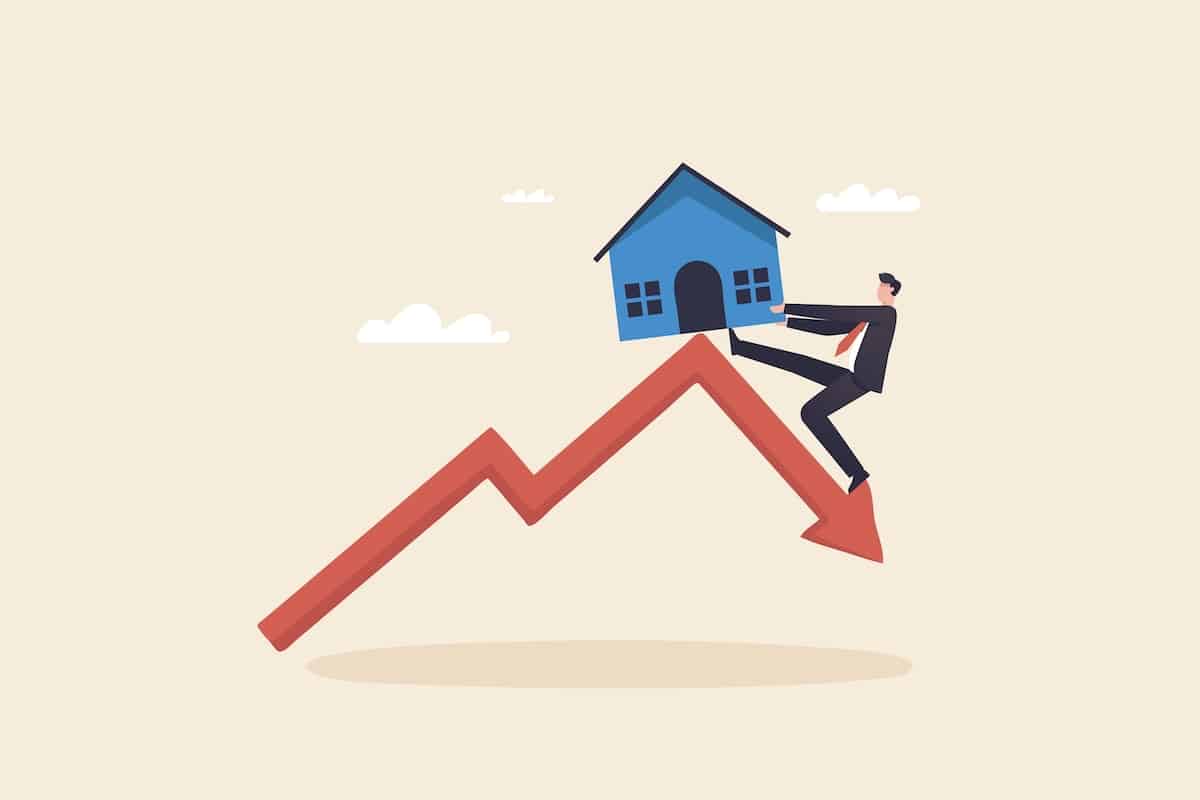
Must Watch Housing Market Crash Indicators
As you further your housing market research, you may wish to consult resources other than the ones listed here.
As a result, these seven indicators provide an excellent starting point for those wanting to learn about the housing market as assessed by the United States Agency for Housing and Urban Development (HUD).
Compared to investors in the stock market who can protect themselves against price falls through swing trading, there’s no easy insurance against housing market falls.
While my swing trading course might be of interest to stock investors, for housing market investors, this post will run through some of the key indicators of a housing market crash.
1) Rates of Homeownership in the Housing Market
As a U.S. housing market indicator, the national homeownership rate (which reflects every county’s average) is also useful. Listed here are the percentages of American households that own the space where they live and reside.
Understandably, a high homeownership rate would suggest affordable housing and loan terms in line with local income levels.
A decline in homeownership rates can also mean that the housing market faces challenges and that you may want to wait for a better time to buy a home.
2) Mortgage Foreclosures and Delinquencies
On the other hand, as tracked by the delinquency index, mortgage delinquencies and foreclosures suggest that buyers are having difficulty making mortgage payments.
They can serve as warning indicators to real estate investors and prospective home buyers that the cost of living is rising, local incomes are declining, and the financial situation of home buyers is deteriorating.
You should raise your radar antennae if you notice mortgage delinquencies or foreclosures occurring in an area.
In addition, seriously delinquent mortgage indexes provide information on how many borrowers have fallen behind on their loan payments by more than 90 days.
If you observe many seriously delinquent mortgages in an area, it is more likely that the residents in that area will be facing foreclosure, and more warning bells should sound.
Increasing trends may indicate that the local economy is struggling or that home purchases were overpriced when borrowers closed on their loans. In general, there are a lot of foreclosures available, so unless you are a DIY rehabber or real estate investor with a risk appetite, you may not find them appealing.
In addition to underwater borrower indices, you can also use them to determine the housing market’s health. These companies monitor the number of homeowners owing more on their homes than they are worth.
Underwater mortgages indicate that the housing market is in decline, and the more you see them, the more evident that is. Meanwhile, a decrease in underwater borrowers indicates a more robust housing market.
3) Housing Supply in the Housing Market
Do you have any idea how much housing inventory is accumulated? Housing supply indices provide information on the number of vacant homes.
In addition, the historical indexes can also indicate how many new and old properties are available simultaneously, as well as indicative of future price changes.
Generally, the lower the housing supply in an area (and the fewer homes available for purchase), the greater the tendency for prices to increase and the greater the likelihood of competition between buyers.
In contrast, if the supply of housing is trending upward (for example, due to overbuilding in an area or the dispersal of people to other areas), prices could decrease.
4) Current Rates Of Mortgage
The 30-year-fixed mortgage rate is another leading indicator of the U.S. housing market.
A lower interest rate usually translates to less money that home buyers have to pay to finance their mortgage and buy a home 30-year-fixed mortgage rates tend to decrease when the economy is doing well and increase the demand for real estate.
The reverse is true when rates rise.
5) Affordability
Rental affordability and home affordability are related to the percentage of residents who qualify for a mortgage or a rental in a specific neighborhood.
Surveyors compile this data by comparing the average price of homes or rental units to the median household income in that area.
Therefore, home affordability is considered low if most individuals would not qualify for a mortgage with their average income.
However, it can also be regarded as high if residents earn substantially more income than what is required to cover the average mortgage for the region.
In particular, first-time homebuyers may find it beneficial to select areas with higher affordability of homes.
According to the Rent Affordability Calculator, people can afford to rent apartments, homes, and condos in a specific area if they spend 30 percent of their income.
The average household spends less than a third or so of their income on rent. The percentage of their income they spend on renting can be low if it exceeds 30%.
If they are in high rental-affordability areas, real estate investors will be able to find more tenants, but they will generally make less money. Rents in low-affordability areas may be higher, but landlords have difficulty attracting tenants.
6) Home Sales
An index of home sales indicates how fast homes are being sold in certain areas. Using the previous annual period as a comparison, they are updated yearly.
With home sales on the rise, home buyers will have greater appetites for houses, and you are likely to have more competition during your home search. However, a sinking housing market will allow you to negotiate better purchase terms.
Based on home sales indexes and the number of homes sold each month in a given location, you can determine if you’re in a buyer’s market or a seller’s market.
7) Modifications In Aggregate
Changes in aggregate indicators can be interpreted as changes in the amount of equity that homeowners control.
By definition, homeowners will have gained equity if the aggregate changes in a positive direction. If it shifts lower, homeowners will lose their equity.
Equity ownership tends to increase as housing becomes more affordable and as homeowners become better at managing their loan payments as a rule.
Alternatively, shrinking equity can mean more homeowners will be unable to afford their homes, and more will have to file for bankruptcy.
Final Word: Housing Market Indicators
Indicators of the U.S. housing market are straightforward to define; however, learning to interpret the data they provide requires substantial skill and training.
Real estate transactions involve elements of timing and luck, but following these housing market indicators can help you make more knowledgeable decisions.
More Articles From Wealthy Living Partners
- Best 5G Stocks That Should be on Your Watchlist
- Ominous Signs of a Housing Market Crash
- Warning Signs a Big Housing Market Crash is Just Around the Corner
- JP Morgan US Housing Market Report – Where the Market is Headed
Disclosure: The author is not a licensed or registered investment adviser or broker/dealer. They are not providing you with individual investment advice. Please consult with a licensed investment professional before you invest your money.
Tim Thomas has investments in real estate.
This post was produced by Tim Thomas / Timothy Thomas Limited and syndicated by Wealthy Living.
Featured image credit: Shutterstock.