
Sure Dividend originally published this excellent post about year-over-year. They gave us permission to republish it here. As a head-ups, we’re not recommending any direct recommendation for the firms shown here, you should do further research before opening an account.
In finance, business, and investing, you are likely to come across the phrase “year-over-year” (abbreviated as YoY) quite often.
First, a quick definition of what year-over-year means. Year-over-year compares results from one time period to the same time period in the previous year.
As an example, if a company reported earnings-per-share (or EPS for short) of $11.00 in fiscal 2018 and earnings-per-share of $10.00 in fiscal 2017, it would have achieved year-over-year growth of 10% (The math: $11/$10 -1 = 0.1 = 10%).
This article explores the meaning of year-over-year, gives a real-world example of its use, and discusses why it matters.
What Is Year-Over-Year?
When a company reports its quarterly financial results, it will typically at least announce its revenue and earnings-per-share for the preceding three-month period.
These figures, along with a host of other quarterly numbers, are provided in the income statement, balance sheet, and statement of cash flow.
Aside from the quarterly financial statements, companies typically also discuss their results in a press release and a conference call with analysts who cover the stock.
In addition to providing the hard numbers, companies will also show the percentage increase or decrease across these metrics. Investors certainly want to see growth in the financial measures that matter the most.
But it is important for investors to dig a little deeper to understand the exact comparison being made.
In a quarterly earnings announcement, a company compare its most recent quarter against the results from the previous quarter. This is known as a quarter-over-quarter comparison, sometimes referred to as a sequential comparison.
This can be valuable information for investors, particularly if the company in question does not operate in a cyclical industry.
If a company does a similar level of business across all four quarters of the year without cyclicality, a sequential comparison can be helpful to gauge a company’s recent performance.
More frequently, companies will show their quarterly numbers alongside the results achieved in the same quarter of the previous year. This is known as a year-over-year comparison.
For example, if a company’s revenue in the first quarter of 2019 was $1.1 billion, compared with $1.0 billion in the first quarter of 2018, it will have a year-over-year revenue growth rate of 10%.
The same year-over-year comparison can be done with annual results. When a company announces its fourth-quarter results, it will also typically show its results for the full year, compared with the previous full year.
It is also wise for investors to research a company’s full-year results, as it allows for a deeper understanding of longer-term trends. As the saying goes, one quarter does not a trend make.
Analyzing sequential results means investors are focusing on two back-to-back quarters, which exposes investors to focusing too much on short-term results.
Instead, it is far more valuable to analyze how a company performed in the full year, compared with the previous year.
Annual comparisons are another advantage of utilizing year-over-year results, that quarter-over-quarter analysis does not provide.
Why Is Year-Over-Year Important?
In many ways, a year-over-year comparison is more valuable for investors than a quarter-over-quarter, or “sequential” comparison.
First, there are many companies that operate cyclical businesses, in which a large portion of annual revenue is generated in a specific quarter.
Think of retailers such as department stores, which generate the vast majority of their annual profits in the fourth quarter, during the busy holiday shopping season.
In that case, comparing the company’s fourth-quarter results to its third-quarter results would give investors the wrong impression, as the fourth quarter will almost always show significant growth from the third quarter.
Real World Example Of Year-Over-Year Usage
Not surprisingly, the fourth quarter is by far the most important for department store operator Macy’s, Inc. (M). It’s when the big holiday sales boost occurs.
In the 2020 fourth quarter, Macy’s generated adjusted earnings-per-share of $0.80.
In comparison, Macy’s reported an adjusted earnings-per-share loss of ($2.21) for the full year, showing how important the holiday quarter is for the company.
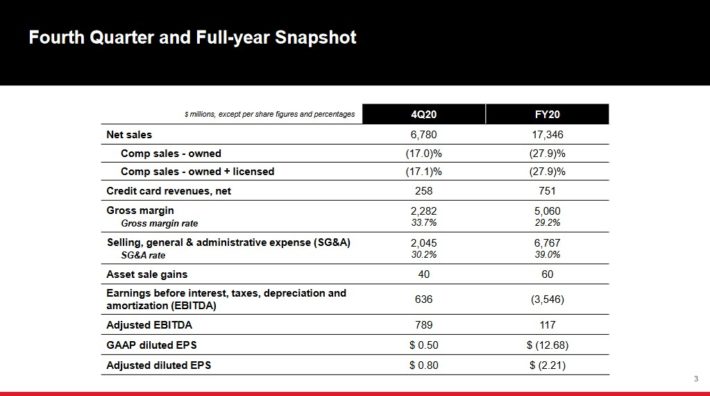
Source: Investor Presentation
The other three quarters are much less important for Macy’s. For example, in the 2020 third quarter Macy’s reported an adjusted earnings-per-share loss of ($0.19).
If investors compared Macy’s fourth-quarter results with the third quarter, they might come to the conclusion that Macy’s growth is stronger than in reality.
But looking at the company’s results on a year-over-year basis would reveal that Macy’s fourth-quarter adjusted EPS actually declined by 62% from the 2019 fourth quarter, due to the impact of the coronavirus pandemic.
The takeaway from Macy’s as an example, is that viewing quarterly financial results on a year-over-year basis gives the most accurate picture of the company’s performance.
In this way, investors will have more of an “apples-to-apples” comparison, and a better chance to reach the correct conclusion regarding the company’s performance.
As a result, judging a company’s fundamentals on a year-over-year basis provides the proper context to truly see how the company is doing.
Final Thoughts on Year-Over-Year
There are many important financial analysis and valuation methods. It’s in investors’ best interest to analyze more than a company’s financial results in a given quarter or year.
Buying and holding high-quality dividend growth stocks can be a very rewarding investment strategy over the long-term. The Dividend Aristocrats are the perfect place to look for the best dividend growth stocks.
You can view a downloadable spreadsheet of all 65 Dividend Aristocrats by clicking on the link below:
Click here to download your Dividend Aristocrats Excel Spreadsheet List now.
In the financial analysis process, investors should be aware of the differences between quarter-over-quarter and year-over-year comparisons.
In almost every instance, it is more valuable to use year-over-year.
More Articles From Wealthy Living Partners
- Planning for Paradise: 25 Things to do in Hawaii
- Essential Things You Should Know About Biden’s First Time Home Buyer Grant Program
- Warning Signs a Big Housing Market Crash is Just Around the Corner
- Dividend Kings Stocks That You Should Add to Your Watchlist Right Now
Learn how to diversify and hedge your long-only stock portfolio. We’ve partnered with Tim Thomas to give you the opportunity to sign up for a free insight into the Swing Trading 101 program. The program has been developed over thousands of hours of trading over hundreds of thousands of dollars across stock, commodities, options, and cryptocurrencies. It’s designed to empower you to take a unique but strategic approach to the markets. Learn more about swing trading.
Neither Tim Thomas nor Timothy Thomas Limited hold positions in the stocks, ETFs, mutual funds, forex, or commodities mentioned.
This article was produced by Sure Dividend and syndicated by Wealthy Living.
Featured Image Credit: Shutterstock